
Simple, Fundamental Data Quality Checks
The bare minimum for effective data pipelines

👋 Hey, this is David. Welcome to the next edition of the Data Engineering With David newsletter. The plan for Data Engineering With David is to create the resource I wish I had when I was in grad school learning to be a Data Engineer.
What’s a Data Quality Check?
A data quality check is a test. The purpose of the test is to discover if your data pipeline is producing output data the way you’d expect it to—or if it’s not.
The test is just a SQL query. You have a particular output (or no output at all) that you expect from this query.
If you get the expected output, the test passes. Hooray!
If you don’t get the expected output, that’s evidence that something has gone wrong in your data pipeline.
The reason your data quality check fails boils down to:
There’s a bug in your data pipeline code
Something changed in your source data, and your pipeline code needs to account for this
Why Data Quality Checks Matter
Have you ever had this interaction before?
Stakeholder: “There’s something wrong with this data you gave me. The widgets column should really never be NULL. I’m seeing some rows that look like duplicates. Are you sure this is right?”
Data Engineer: [sweating bullets] “Let me double check this and get back to you!”
This situation is no fun to be in.
Stakeholders with business knowledge are good at spotting weirdness in the data that you might miss if you don’t have the same domain experience.
You obviously want to avoid this situation as much as possible. Data quality checks are a good place to start.
As a side note, the more complex the data you work with, the more likely it is that your code is going to have bugs and produce the “wrong” output. Some degree of errors are expected—but you should still try to rule out obvious problems early on.
Additionally, it's a guarantee that something is going to break or change in your source data at some point. Your pipeline might produce a perfect dataset now, but someday the change in your source data is going to mess that up. You want to know about this before your stakeholders discover it by looking at messed up data!
3 Simple Checks You Should Always Do
Here’s a set of data quality checks you can do on basically any data pipeline.
Check #1: Total row count
The principle here is that it often makes sense for the total number of rows in a particular table (usually an intermediate step in the process) to have the same row count every time you run the pipeline.
If you rerun your pipeline, and the row count changes, you might be creating unintentional duplicates (or worse).
You can count the rows in each table and subtract them from one another. The output of this query should be 0 if the row counts match.
SELECT
  COUNT(*) - (SELECT COUNT(*) FROM new_table) AS row_diff
FROM original_table
Check #2: NULL count
With a NULL count, you may want to check for:
Does a certain column ever have NULLs?
Does a certain column ever have more than X% NULLs?
Does a certain column ever have more than a specific count of NULLs?
Here’s how to check for NULL count in a specific column:
-- Identify number of rows that are NULL for a specific column
SELECT
  COUNT(column_name)
FROM my_table
WHERE column_name IS NULL
You can also use SUM() with CASE WHEN to see what percentage of rows in that particular column are NULL:
-- Identify percentage of rows that are NULL for a specific column
SELECT
  SUM(CASE WHEN column_name IS NULL
           THEN 1
           ELSE 0
           END) / COUNT(*) as pct_NULL
FROM table_name
For Google BigQuery users specifically, here’s a nifty little piece of SQL with Regex that can be used for seeing a count of all NULL rows by column. This is more useful for debugging your pipeline than as a specific test to perform (source):
-- Get a list of columns and the count of NULL rows for each column
SELECT col_name, COUNT(1) nulls_count
FROM `project.dataset.table` t,
UNNEST(REGEXP_EXTRACT_ALL(TO_JSON_STRING(t), r'"(\w+)":null')) col_name
GROUP BY col_name
Check #3: Repeated record count
Your tables should always be unique on the join key (primary key). Sometimes, when you join multiple tables together, a mistake in a join condition can cause the join to match more rows than you intended. The result is duplicated or repeated rows in your output table. You were supposed to have 1 row per join key, but now you have 2, or 3, or 1024!
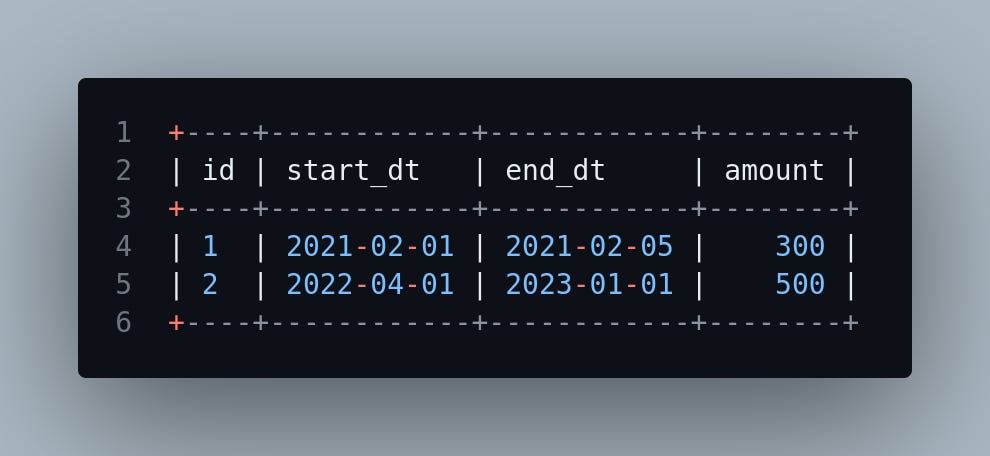
What your data should look like:
What it actually looks like:
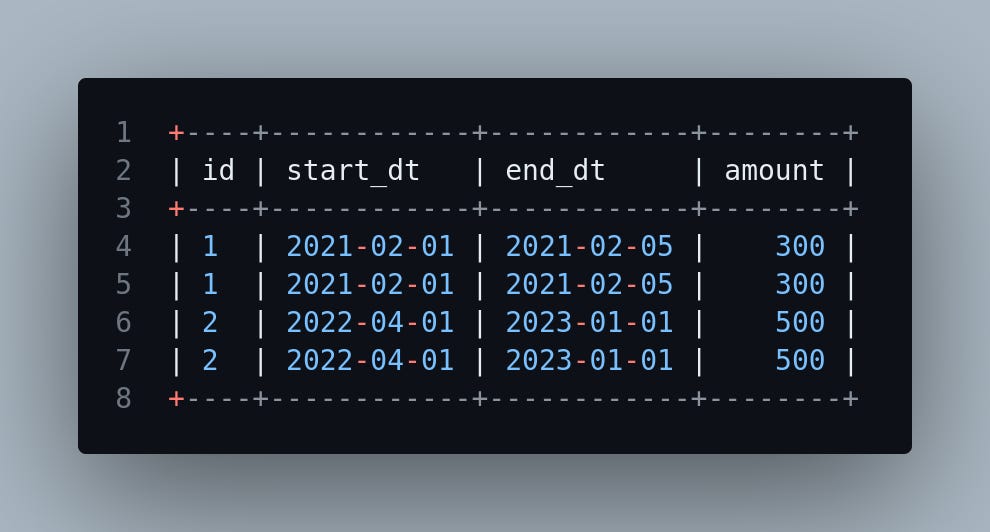
Side note: in the example above, if these were the only columns in the data, we could just run a SELECT DISTINCT to eliminate the duplication. That still wouldn’t solve the root cause, so it’s not the best solution. Let’s assume there are more columns in the output table that aren’t pictured above, and that the cause of this duplication is a join condition in your pipeline that applies to more rows than you intend—a common error to have.
You can check whether or not the join key is unique by doing a distinct record count. In this example, gameid is our unique key, and there should only be 1 row for every gameid.
-- In this example, we're expecing only 1 row per gameid.
-- In cases where there are multiple rows for gameid, something
-- must have gone wrong in our pipeline to create repeated rows.
SELECT
gameid
,COUNT(1)
FROM games_table
GROUP BY gameid
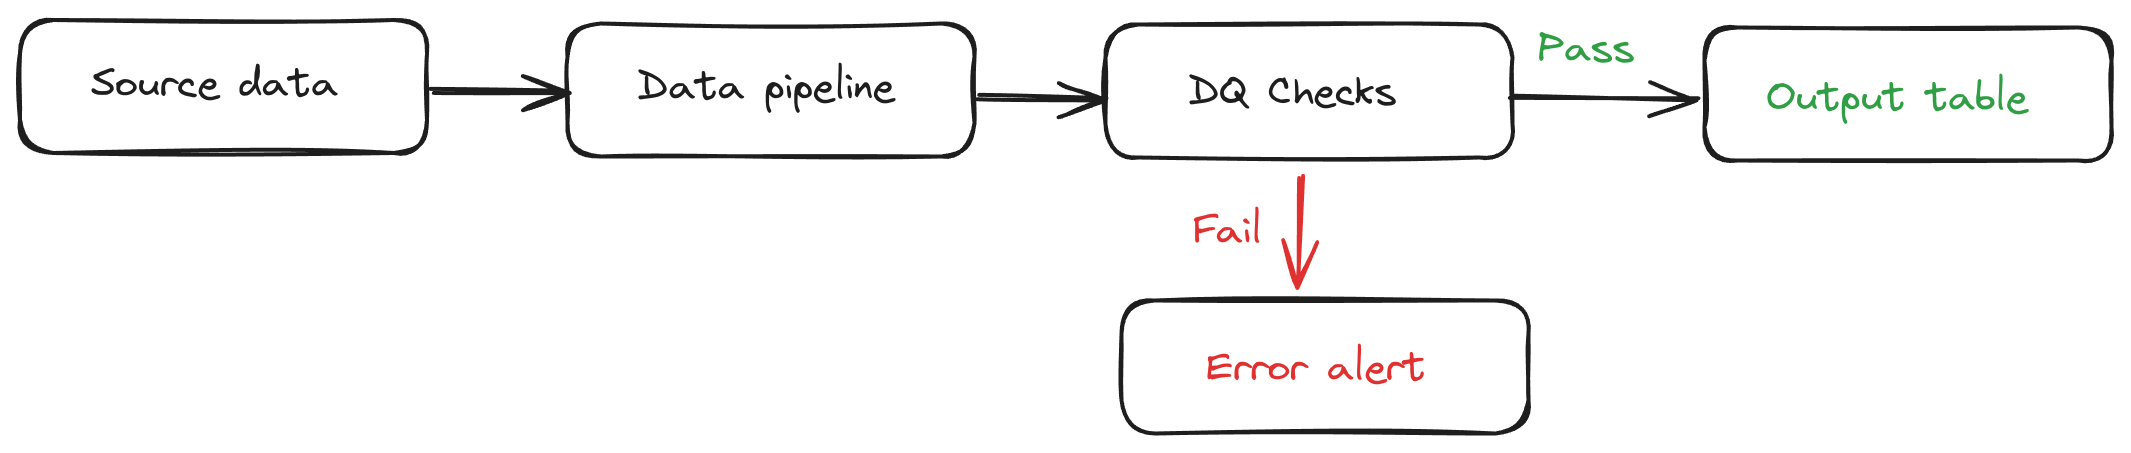
HAVING COUNT(gameid) > 1How to Integrate Data Quality Checks in a Data Pipeline
Depending on what makes sense, you can put these at the end of the process, i.e. these tests must pass or a new version of your output table won’t be published.
It may also make sense to build some of these into intermediate stages of the pipeline to avoid running the full process if tests in the early stages fail. It’s a waste of time and money to run the whole pipeline with bad data.
These checks are also useful to perform if you make changes to parts of the process to test whether your changes broke something they shouldn’t have.
Since you know the expected results of all these queries, you can write code in Python that executes each query and fetches the result. You could compare the query results with what you expected, or even use Pytest to handle this.
You can also use this strategy to set a tolerance boundary. Maybe there’s a level of error or drift in your data that’s acceptable. For example, instead of performing a comparison like this:
null_count_query_result == 0
You could do this:
null_count_query_result < 100
Final Thoughts: Unfortunately, Data Quality Checks Are Not Enough
These checks are a great place to start, but they’re just a baseline. There are many scenarios where the data in your output table is no longer correct, and the data quality checks in this post won’t be able to help you:
Certain values are out of bounds based on business rules (i.e. a negative purchase amount)
The process that creates the source data fills in a default value when something goes wrong—and you’re unaware of this
Some degree of NULL values are expected, but the amount may change over time and there’s no clear way to know what counts as “too much” or “too little”
In theory, you could program an infinite number of data quality checks to handle every conceivable situation. That’s not a reasonable solution, and doing something like measuring the drift in distributions of values over time is likely a better approach. But that’s a topic for another post!